Analysis

Analysis
After executing a load test, we need to interpret the test results. For result interpretation, we use Listeners in JMeter. These listeners provide different matrices about the load test. In this post, we will see the most commonly used matrices, their meanings and the how they are calculated internally from raw data.

Result matrices by Aggregate Report Listener-
Label- Label is the name of the sample or the Transaction Controller
Samples - The total number of samples corresponding to a given sample
Average - The average time taken (in milliseconds) to execute the requests under a given label. So, if there are 10 samples getting executed then average time taken will be-
Average = Total time taken by all samples /#samples
Median - The median is basically the middle value of response time in the sorted list of samples
90% Line - The Apache JMeter manual describes 90% line as- "90% of the samples took no more than this time". It is actually the 90 percentile of the response times of the samples -
90 percentile = (90/100)*N+1/2 where N is the number of samples
So, if there are 10 samples then 90%line will be 9.5 or 9. It means the 9th value in the sorted list of samples (sorted according to ascending order of their response times) will be the 90% line value.
Min - The minimum time (in milliseconds) taken by the sample
Max - The maximum time (in milliseconds) taken by the sample
Error % - Percentage of errors in the samples
Throughput - Throughput as we all know is output per unit time. In JMeter terms we define throughput as the amount of load applied on the server. So, numerically-
Throughput = Total number of requests to the server/ Total time
or Total number of requests to the server/(End time of last sample -Start time of first sample)
Here we just defined Total time in which load was applied on the server as time duration between Start of first sample and end of last sample.
KB/sec - The metric KB/sec is nothing but the throughput measured in terms of bytes. So,
KB/sec = (Throughput*Average bytes) /1024


Here Average bytes is the average value of the sample response in bytes and the term 1024 is used to convert the value (Throughput*Average bytes) into kilobytes.

How to generate HTML report

How to generate report(HTML format)

GUI mode:
once test got completed the results will be stored in a .jtl extension file.
Step 1: Navigate to tools and choose generate HTML report (see the following screenshot)
step 2: browse the result file (jtl file)
step 3:browse the user.properties file
step 4: give the path where to generate the html formated file.
Step 5: hit on generate report
step 6: Navigate to given output directory for HTML format report file.


Non-GUI mode
Once the test was executed in non-gui mode the jtl file will be saved in the given directory. After the execution follow the below steps to generate HTML report in non-gui mode.

Step 1: open the terminal/ command propt
Step 2: Enter command
for example :
I written the following command to generate the report in non-gui mode.
/home/madhureddy/Desktop/apache-jmeter-5.1.1/bin/jmeter -J jmeter.save.saveservice.timestamp_format="yyyy/MM/dd HH:mm:ss" -g/home/madhureddy/Desktop/Chatak_AFCS_23_MAY_Duration_15min_100TC_60R_1.jtl -o /home/madhureddy/Desktop/Chatak_AFCS_23_MAY_Duration_15min_100TC_30R_1

Explanation for the above example how i written the command:


How to record the script _ saving test plan _ Execution order

Saving the test plan
You can save an entire Test Plan either by using Save or "Save Test Plan As ..." from the File menu. Or by default save button will be there in jmeter hit on that save the script by providing a name .jmx.
Running a test plan
You can run your Test Plan choosing Start (Control + r) from the Run menu item. When JMeter is running, it shows a small green box at the right hand end of the section just under the menu bar.
The numbers to the left of the green box are the number of active threads / total number of threads. These only apply to a locally run test; they do not include any threads started on remote systems when using client-server mode .
In the following screenshot you can see the save and run buttons.


Recording Script with Jmeter
we can record the script using the jmeter non-test element( Http test script recorder)
Step 1: open jmeter
step 2: add to non test element (HTTp test script recorder)
step 3:Now in http test script window,port value will be 8080 by default,otherwise set it to 8080
step 4:In the drop down list,select recording controller as the target controller.
In the next step,add recording controller,under http test script recorder.Recording controller enables to record script under it,so that it will be in a structured way.
Step 5 :The workbench is now ready to record scripts.Now open web browser and go to settings.
Step 6:In settings,go to proxy server and check the check box.
Step 7:Type localhost in the address text box and in the port provide the port number which we have given to proxy server port ie 8080.
step 8:Finally click ok button and close the window.
Step 9:To start recording the script, type url of the application in the browser and press enter. Now in recording controller under workbench,some http request will be recorded. For eg, if the static web site has five pages and if we want to record those five pages in different group or specified name,then it can be done.
Step 10:In the next step, add simple controller to the http test script recorder and select the entire http request from the recording controller and paste it under simple controller.
Step 11:Once the recording is done,go to internet options and uncheck the check box in proxy server and save it.
Step 12:In the next step,copy the script to test plan under thread group.
Step 13:Finally, add listeners to the thread group.Add agrregate grph,view results tree and response time graph to view the results.
Note: see the following screenshot for reference


Execution order of Test Elements

Following is the execution order of the test plan elements:
1. Configuration elements
2. Pre-Processors
3. Timers
4. Sampler
5. Post-Processors (unless SampleResult is null)
6. Assertions (unless SampleResult is null)
7. Listeners (unless SampleResult is null)

Distributed load testing:

Distributed load testing:
Distributed load testing is the process using which multiple systems are used for simulating load of large number of users. In JMeter, this is achieved by creating a Master-Slave configuration.
The reason of using more than one system for load testing is the limitation of single system to generate large number of threads (users).
For distributed load testing we need to create Master-slave configuration wherein

Before we start,there are a couple of things to check.
  • the firewalls on the systems are turned off.
  • all the clients are on the same subnet.
  • the server is in the same subnet, if 127.0.0.1 ip addresses are used. If the server
  • Make sure JMeter can access the server.
  • Make sure you use the same version of JMeter on all the systems. Mixing versions may not work
  • correctly.

Once you've made sure the systems are ready, it's time to setup remote testing. The tutorial assumes you already have JMeter installed on all the systems. The way JMeter works is 1 master controller initiates the test on multiple slave systems.


Terminology
Before we dive into the step-by-step instructions, it's a good idea to define the terms and make sure
the definition is clear.
Master – the system running Jmeter GUI, which controls the test
Slave – the system running jmeter-server, which takes commands from the GUI and send requests to the target system(s)
Target – the webserver we plan to stress test


Master will control all the slaves and collect the test results.
To make the system work firewall needs to be turned off and all the systems need to be in same subnet. Also, preferably all the systems need to use same version of JMeter and Java.

  1. First of all we need to start the jmeter-server.bat in the slave systems. For this just go to the bin folder inside JMeter home directory and run the batch file jmeter-server.bat(for windows) or jmeter-server (for linux).
  2. Now on the master system open the properties file jmeter.properties and edit the remote_hosts entry. Remove the loopback address's value (127.0.0.1) for the remote_host entry and specify the IP addresses of all the slave systems separated by commas.
In the following screen shot you can see initially only one url is there.


Now i am adding two more hosts under remote hosts and configeration . You can see the same in the below screenshot


Like this you can add the hosts as many you want.

Starting the Test
At this point, you are ready to start load testing. If you want to double check the slave systems are working, open jmeter.log in notepad. You should see the following in the log.
Jmeter.engine.RemoteJMeterEngineImpl: Starting backing engine
If you do not see this message, it means jmeter-server did not start correctly. For tips on debugging the issue, go to the tips section. There are two ways to initiate the test: a single system and all systems.


How to Start a single server   


step1. click Run at the top

step2. select Remote start

step3. select the IP address
(see the screenshot )


How to start all servers
 step1. click Run at the top
step2. select Remote start all or use CRTL-Z (see the screenshot)


FTP Request Sampler

FTP request sampler
The following steps we have to follow to test the FTP server.
Step 1: open jmeter
step 2: add thread group to test plan
step 3: add config element as FTP request defaults. ( see the following screen shot)


we have to enter configuration details .
The Config Element- "FTP Request Defaults" is required to be added as child of the Thread Group. Here you can add configure default properties that can be used by multiple "FTP Request sampler" like FTP server name, port, remote file, local file, mode etc.
Step 4: Add the sampler FTP request (see the below screenshot)

            Enter all the configuration elements as like as FTP request config element but additionally we have to enter credentials ( user name and password) to connect to the FTP server.

Step 5: Add the listeners . ( To know the output we have to add the listeners.)
Step 6: add assertion also if you want. (For validation)
step 7: Run the test.


Data Base Testing (JDBC Request)

Data Base Testing (JDBC Request)
Using JDBC request sampler we can test the database.
Steps to do the database testing.
Step 1: open jmeter
step 2: add thread group to test plan
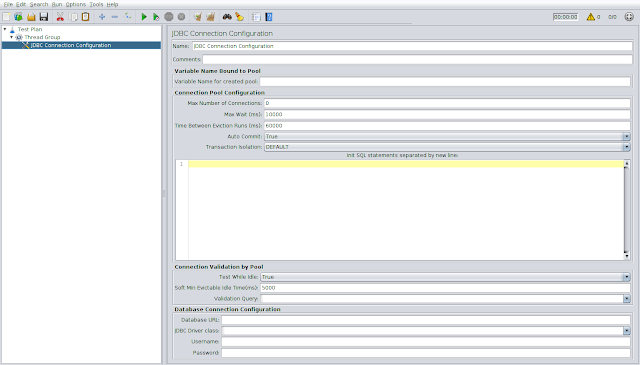
step 3 : Add the config element (JDBC connection cofig)

( see the following screenshot for reference.)


 The Config Element- "JDBC Connection Configuration" is required to be added as child of the Thread Group. The properties in "Connection Pool Configuration" and "Connection Validation by Pool" can be kept with default values. Appropriate values for the following parameters need to be configured in "Database Connection Configuration" section-
  1. Database URL - The URL of the database server
  2. JDBC Driver class - The database driver name e.g. com.mysql.jdbc.Driver
  3. Username - The username of the user having access to run the SQL query in the database
  4. Password - The password of the user having access to run the SQL query in the database
step 4: Add JDBC request sampler.
(see the following screenshot)


The Sampler- JDBC Request needs to be added as child of the Thread Group below the JDBC Connection Configuration. Here we can select the type of SQL query form the "Query Type" drop-down and place the SQL query in the "Query" text field.

Step 5: Add the listeners . ( To know the output we have to add the listeners.)
Step 6: add assertion also if you want. (For validation)


step 7: Run the test.

Correlation

Correlation
Correlation is the most important aspect of scripting. It usually includes fetching dynamic data from preceding requests/calls and posting it to the subsequent requests.
Let's take an example to find out why exactly we need correlation. Suppose we have recorded a scenario in which-
User enters login details and click OK button
Home page opens and user take further actions
Now, if we just playback this script, the test will fail even for a single user. This is because of the authentication mechanism used. When we login to a website, session variables are dynamically created. These session variables are passed to the subsequent requests and help validation & authentication of the actions performed. So, one cannot just record and playback the requests having these variables. Here, we need to correlate the web requests with the dynamic variables. And for correlation, we need to use the "Regular Expression Extractor" which makes use of regular expressions. So, before going deep into Correlation, let's first understand "Regular Expressions".

Regular expression
Regular expressions are used to fetch data from a string based on a search pattern. Basically, in order to extract any value (generally a dynamically created value) from a string response, we define a left bound of the variable then some wildcard characters and then a right bound-
(left boundary) (body to be capture) (right boundary)
For example : The server is returning the session id for login request . we wanna capture that session id .For that we have to use regexpression extractor
server returning value is
session id =”1e234323254343464”/>?
Left boundary = session id=”
body to capture = 1e234323254343464
right boundary = ”/>?
The regurar expression is ---------- session id =”(.+?)” />?
If we use the above expression every reply the expression will extyract the server return value.
Where
. “- match any character
“+” - one or more times
“? “- stop when first match succeeds
Steps to follow to capture dynamic value:
step 1: open jmeter
step 2: Add thread group
step 3: add sampler
step 4: Add regular expression extractor
From the following screen shot you can find more details.
Configeration elements in regular expression:
Name : you can give any meaning ful name as a name.
Name of created value : give any meaning full name but to use extracted / dynamic value some where at that time we have to use same name as a parameter.
Regular expression: here we have to peaste the regular expression which is formed by you.
Templet: here enter the posion of occurence of the dynamic value (ex : if it is first occurance then give like $1$)
Match no : If you wanna pick random number then give 0 if not leave blank.